Concentrators by Sub-Population: Postsecondary
How to Read this Dashboard
What is a Concentrator: A postsecondary student who: (1) completes at least 12 academic or CTE credits within a single program area sequence that is comprised of 12 or more academic and technical credits and terminates in the award of an industry- recognized credential, a certificate, or a degree; or (2) completes a short-term CTE program sequence of less than 12 credit units that terminates in an industry- recognized credential, a certificate, or a degree.
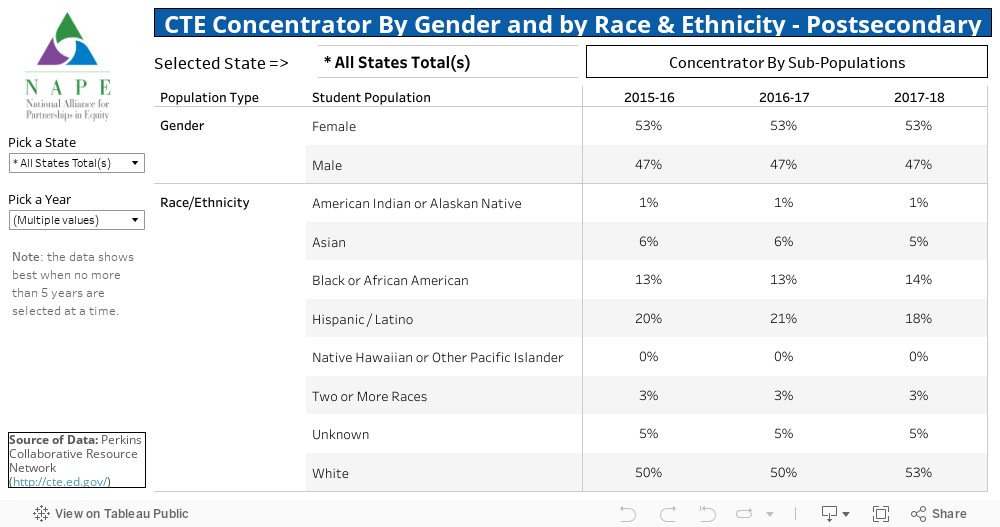
This dashboard has 3 tabs representing Postsecondary data:Tab 1 – Concentrator By Percent By Sub-Populations – this shows the data by Gender and Ethnicity. Pick the years and states you want to view.
Tab 2 – Concentrator by Number By Sub-Populations – this shows the data by Gender and Ethnicity. Pick the years and states you want to view.
Tab 3 – Concentrator Chart – this shows the data by Gender and Ethnicity represented by a pie and bar chart for a single year.