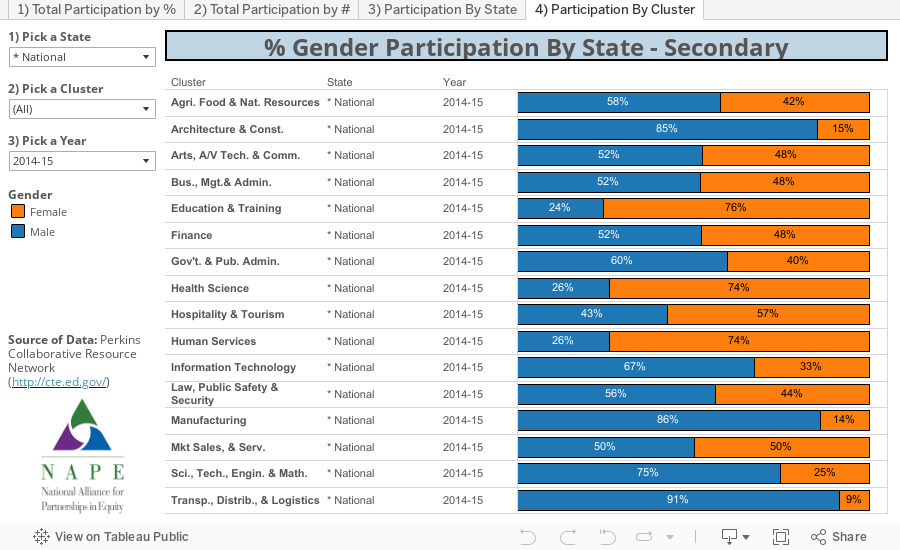
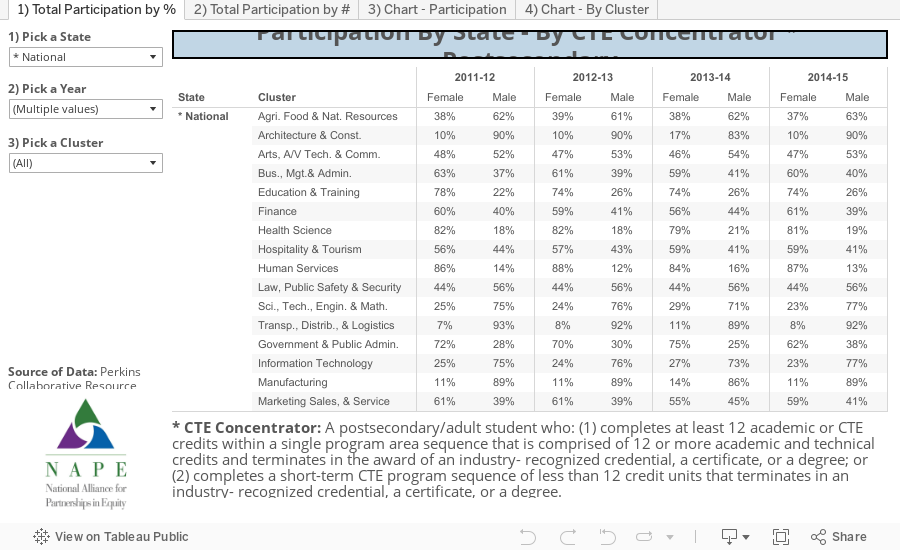
NAPE’s data dashboards show the number and percentage of concentrators1 participating in CTE programs. You can use the dashboard to compare the participation rates of males and females in each of the 16 career clusters for every state. These data were obtained from the U.S. Department of Education, Office of Career Technical and Adult Education, as reported to them by each state as part of the Perkins Consolidated Annual Report required under the Carl D. Perkins Career and Technical Education Act of 2006.
Use the dashboard to compare how your state’s enrollment by gender for each of the career clusters compares to another state or to the nation. If you are from a local education agency or community college, consider comparing your own enrollment in programs within these career clusters as a benchmark. For a crosswalk of programs by six-digit classification of instructional program (CIP) codes to career clusters, go to NAPE’s nontraditional occupations crosswalk. You can also look at the nontraditional2 crosswalk to determine what program CIP codes are nontraditional within each career cluster.
Although each of the career clusters contains programs that are nontraditional for males, nontraditional for females, and/or gender neutral, these data are the only data available at the national level that is disaggregated by program area. The ideal data comparison to benchmark your program data would be at the six-digit CIP level, which may be available from your state. For state contact information, go to NAPE’s state directory.
1 The students counted in these dashboards are concentrators in career and technical education. The definition of concentrators can vary from state to state. Click here to see your state’s definition of CTE concentrator.
2 Nontraditional CTE programs are those that prepare students for career fields where less than 25% of those individuals employed are of one gender.
NAPE can develop data dashboards for local or state education agencies to help you better understand equity gaps to support your process of program improvement. These dashboards, depending on the data available, can include school- or college-level data disaggregated by program and student demographics (i.e., gender, race, socioeconomic status, disability, English language learners, single parent/displaced homemakers, etc.). If you would like to work with NAPE to develop a data dashboard, then please complete a request for professional development form.